Blood Report Redesign
Blood Report Redesign
Turning a post-pivot mess into a scalable reporting system
Overview
Overview
Company type
Company type
The NU, Longevity B2B2C startup
The NU, Longevity B2B2C startup
Role
Role
Product Designer. Worked alongside an Art Director initially, then led design independently. Led external agency. Collaborated with PM, Science, and Tech team.
Product Designer. Worked alongside an Art Director initially, then led design independently. Led external agency. Collaborated with PM, Science, and Tech team.
Platform
Platform
Web SaaS (desktop-first), part of a larger longevity OS
Web SaaS (desktop-first), part of a larger longevity OS
The situation
The situation
I joined this project right after a B2C to B2B2C pivot. The blood report - a critical feature for practitioners - was still a static PDF embedded in the web app: 70+ biomarkers in an endless scroll, with no interactivity, trends, or filtering. A quick fix that delivered a poor user experience for practitioners at the time.
I joined this project right after a B2C to B2B2C pivot. The blood report - a critical feature for practitioners - was still a static PDF embedded in the web app: 70+ biomarkers in an endless scroll, with no interactivity, trends, or filtering. A quick fix that delivered a poor user experience for practitioners at the time.
Before
Before
My approach
My approach
"Rather than applying quick fixes, I reframed the problem from "How do we make this report better?" to
"Rather than applying quick fixes, I reframed the problem from "How do we make this report better?" to

"How might we help practitioners tell the story of a patient's health?"
This shifted our focus from data display to the narrative. Practitioners don't just read numbers - they guide patients through what's wrong, what's improving, and what to do next.
I mapped trends requirements across all platform reports (Blood, Genome, Microbiome, Age Clocks) before designing anything. This ensured whatever we built would scale, not just solve one report."
Key design decisions
Key design decisions

01
Dual navigation
Supporting different mental models
02
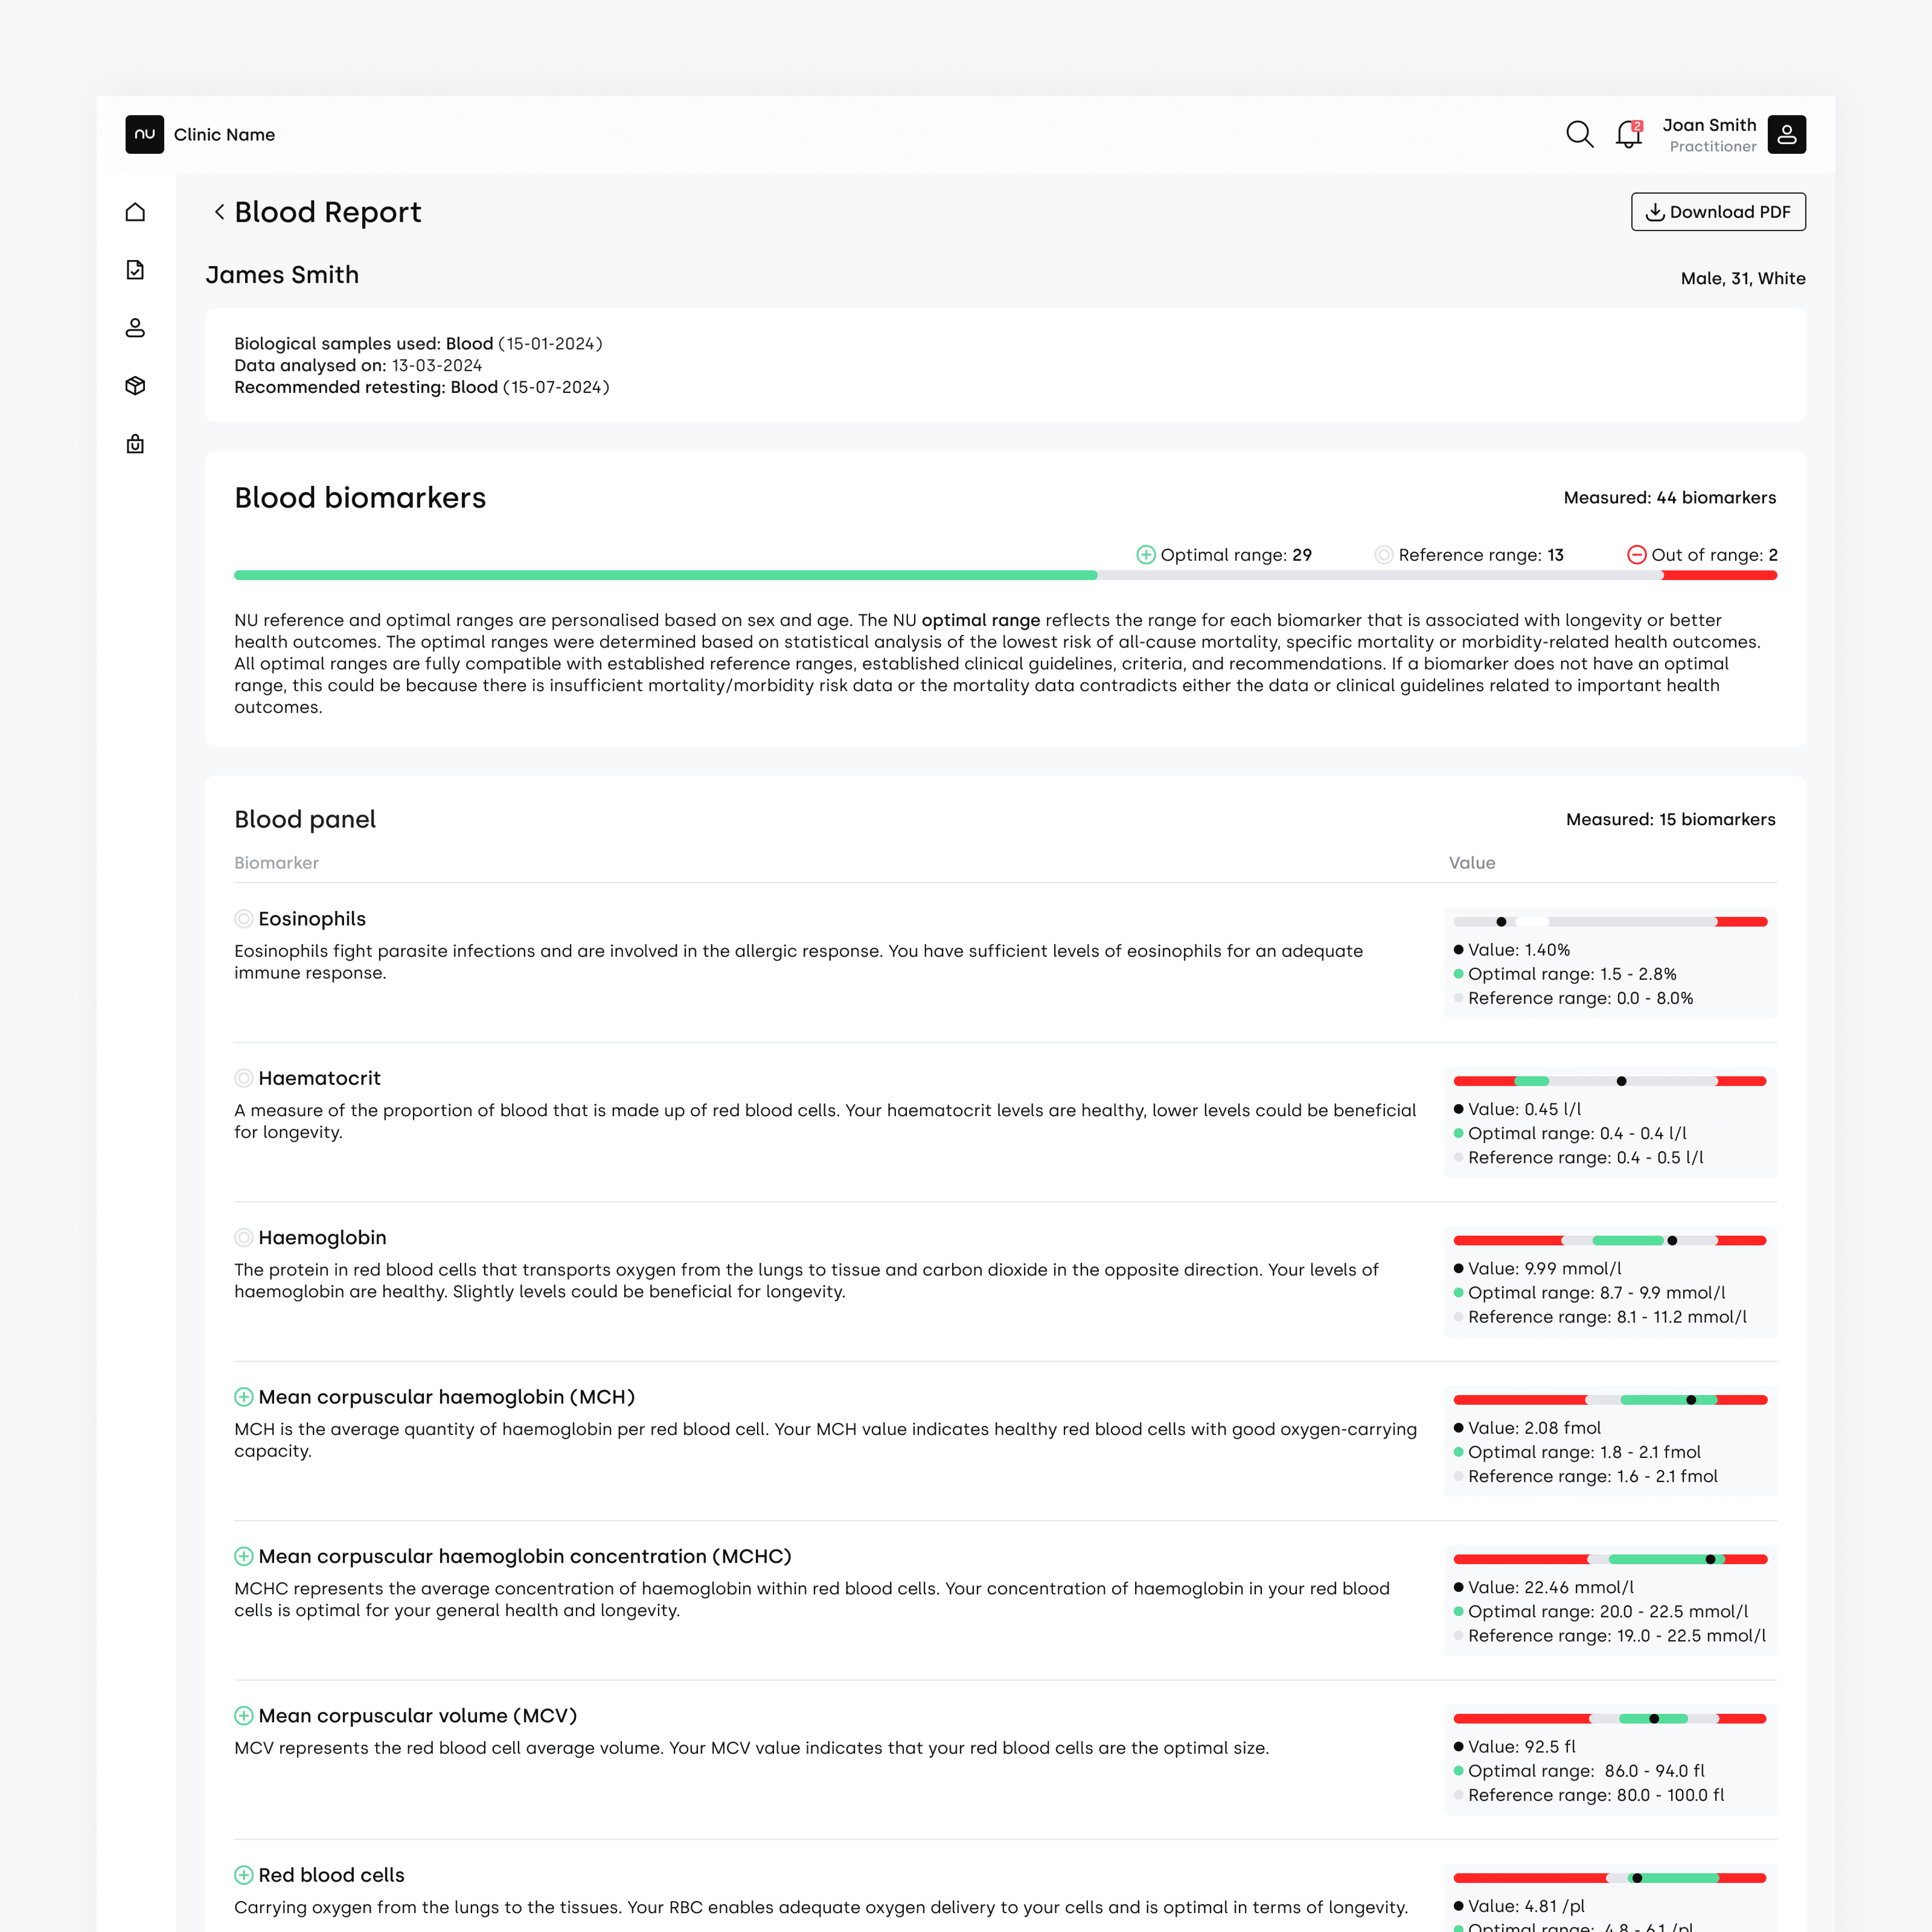
Progressive disclosure
Overview first, depth on demand
03
Unified trend component
Designing for edge cases
04
Modular detail panel
Building for scale
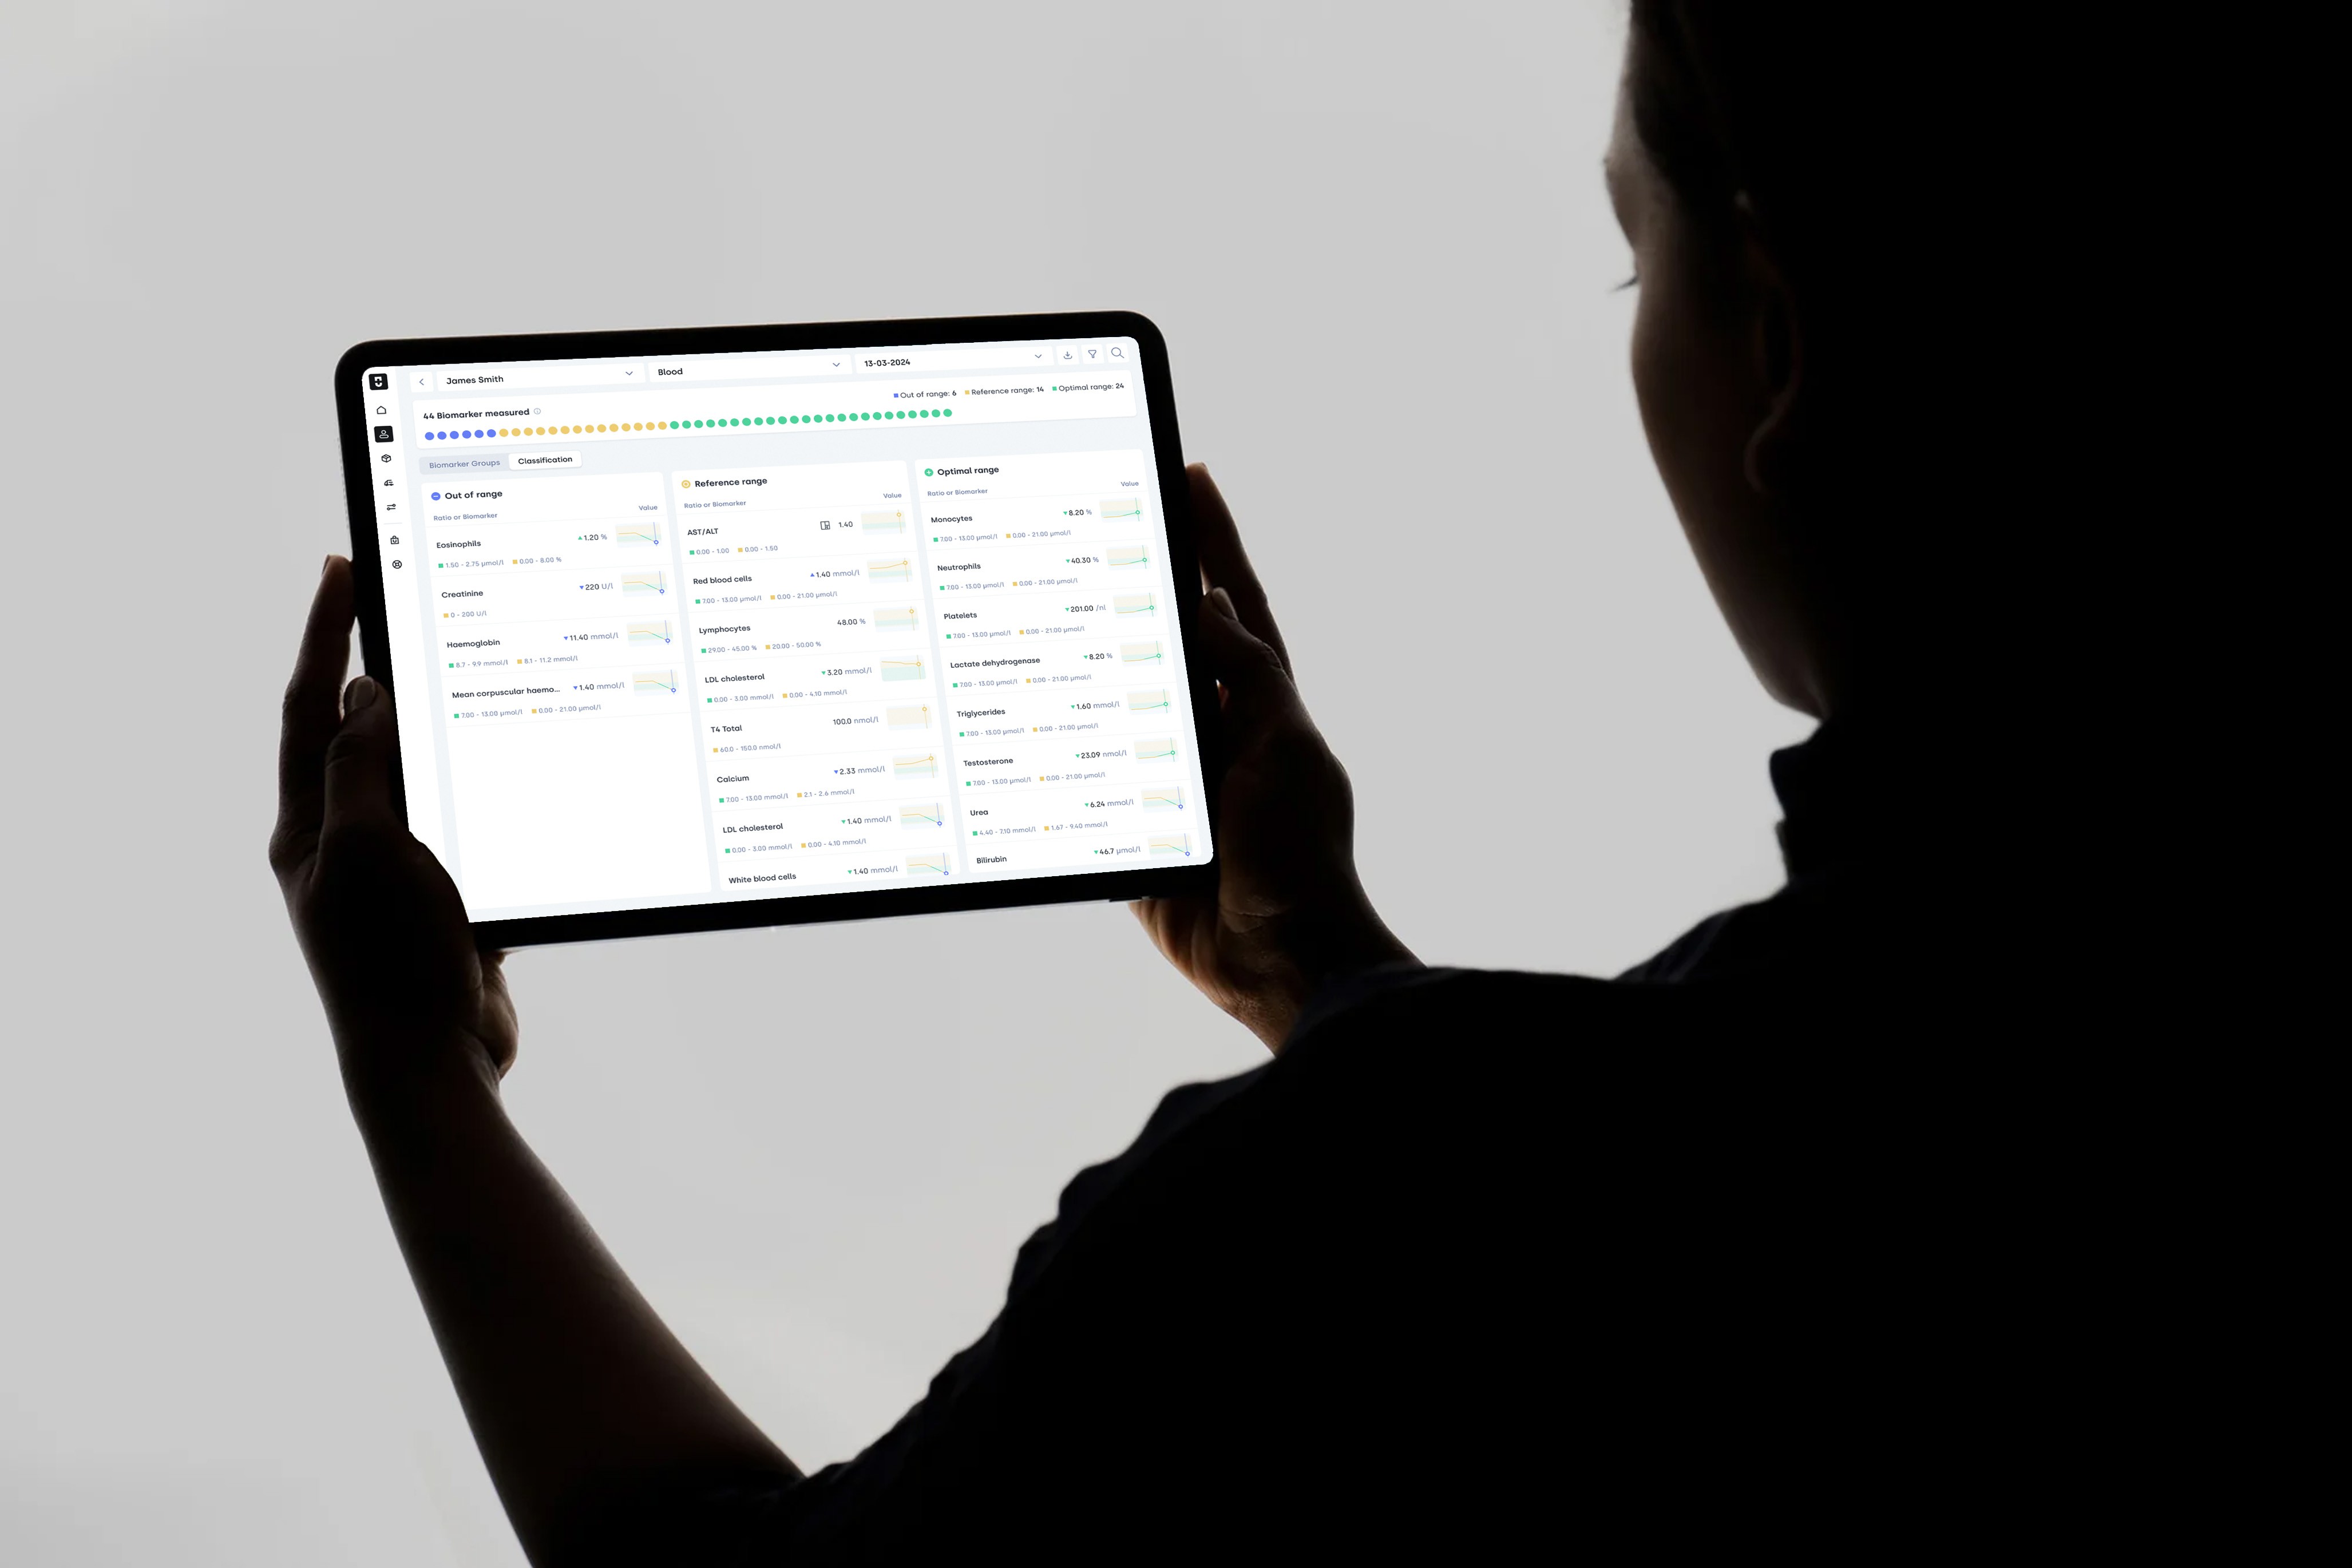
Research showed that practitioners work differently. Some scan by severity, others by body system. We needed to support both. I designed two views:
Groups view: Collapsible panels by clinical category for narrative-driven consultations
Classification view: Three columns by status (Out of range / Reference / Optimal) for quick problem identification
One report, two workflows. Practitioners choose.
01
Dual navigation
Supporting different mental models
02
Progressive disclosure
Overview first, depth on demand
03
Unified trend component
Designing for edge cases
04
Modular detail panel
Building for scale
Research showed that practitioners work differently. Some scan by severity, others by body system. We needed to support both. I designed two views:
Groups view: Collapsible panels by clinical category for narrative-driven consultations
Classification view: Three columns by status (Out of range / Reference / Optimal) for quick problem identification
One report, two workflows. Practitioners choose.
What didn't work
What didn't work
Not every decision was right the first time.
Classification-first assumption: I assumed most practitioners would prefer scanning by severity. User calls revealed many prefer a panel-by-panel narrative. Hence, the dual navigation. Neither view was wrong, we needed both.
Trend component inconsistency: Described above. A reminder that edge cases expose design flaws faster than happy paths.
Outcomes
Outcomes
For practitioners
For practitioners
Eliminated manual ratio calculations
Eliminated manual ratio calculations
Dual navigation supports different narrative consultations
Dual navigation supports different narrative consultations
Inline trends provide historical context without extra clicks
Inline trends provide historical context without extra clicks
For the product
For the product
Modular components reused across four report types
Modular components reused across four report types
Unified trend component reduced front-end complexity
Unified trend component reduced front-end complexity
Pattern library established for future reports
Pattern library established for future reports
For the team
For the team
Cross-functional alignment improved through early engineering involvement
Cross-functional alignment improved through early engineering involvement
External agency was effectively directed with clear design direction
External agency was effectively directed with clear design direction
Key learnings
Key learnings
Design debt compounds. Address it early.
Design debt compounds. Address it early.
Systems thinking pays off - build patterns that scale.
Systems thinking pays off - build patterns that scale.
Understand and build for users’ mental models.
Understand and build for users’ mental models.
Collaborate with engineering early for better design.
Collaborate with engineering early for better design.
Other projects

Lead product designer
Empowering healthcare with tailored longevity solutions

Building feedback loop system
Designed feedback system for continuous improvement
Other projects
Lead product designer
Empowering healthcare with tailored longevity solutions
Building feedback loop system
About Subscription

Currently based in Slovenia
Currently based in Slovenia
Currently based in Slovenia